Profit taking bites
A shakeout was due, but the background for gold and silver is very bullish both technically and fundamentally
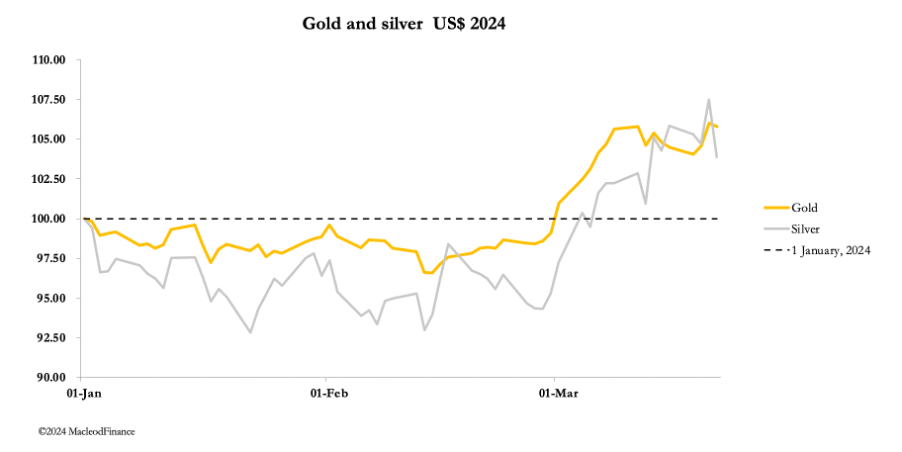
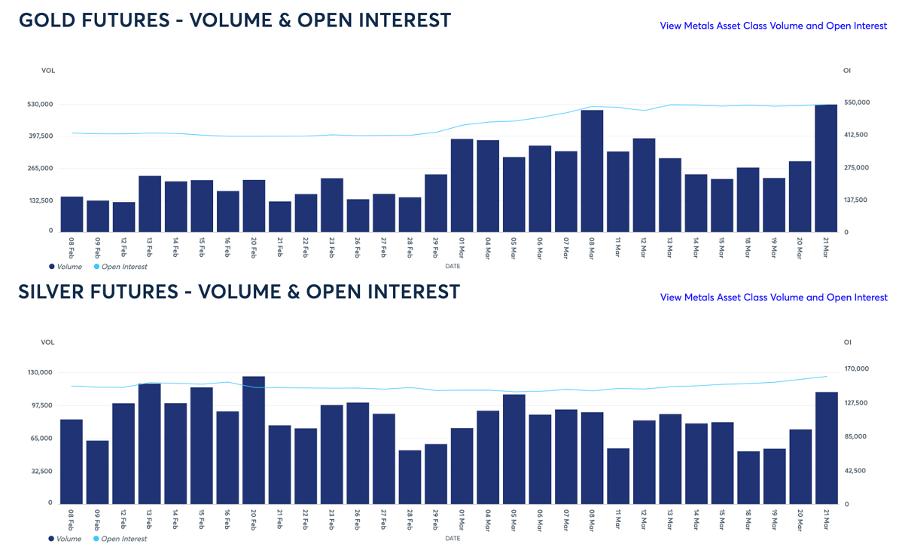
Gold and silver both had spectacular weeks, with gold peaking at a record $2222 overnight on Thursday and silver at $25.75, before profit-taking set in. In European trade this morning, gold was trading at $2166, up $4 on balance from last Friday, and silver at $24.58 was off 60 cents. Comex volumes were moderate except for yesterday when there was a significant peak and subsequent sell-off. These are next:
The Thursday peak followed the Fed’s FOMC decision to hold the funds rate at 5.25% to 5.5%, but in forward guidance the Fed maintained a “no comment” stance and markets are still expecting in June the first of possibly three cuts.
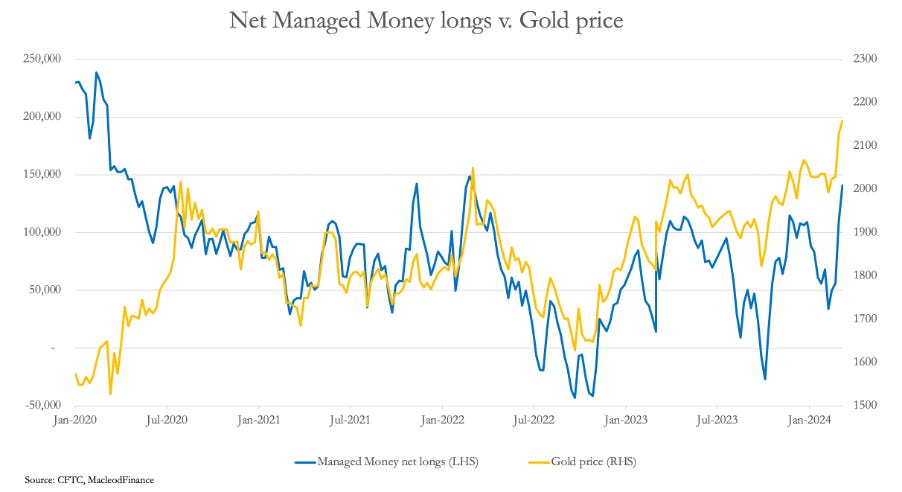
Meanwhile, speculative paper market positions on Comex, and presumably in London as well, have increased against a background of bullion shortages. This is reflected in the Managed Money category Comex gold contract, comprised mainly of hedge funds. The next chart shows how their net position and the gold price have evolved.
On 10 October 2023, hedge funds were net short of 26,767 contracts when gold sold off to $1823. With gold hitting a peak of $2160 on 12 March (the last COT release), hedge funds were net long 141,083 contracts. That’s a turnaround of 167,850 contracts representing 522 paper tonnes. This rapid swing from deep bearishness to overt optimism reflects unstable speculation. It is easily taken out by the Swaps, comprised of professional traders (mostly bullion banks) who take the short side. All they need to do is to mark down paper prices at the appropriate time to take out the stops.
Fortunately for the Swaps, hedge funds keep coming, and jobbing on the short side is extremely profitable. But there is a problem. In the past, the bullion banks close to the miners and refiners have easily persuaded them to hedge production forward, allowing the Swaps to put a cap on their net short positions. With the rise in the gold price, this category has reduced is forward hedging, illustrated in our next chart.
Consequently, the dollar value of the Swaps remains stubbornly high at $53bn gross and $36.7bn net. There are 29 Swap traders short, giving an average exposure of $1.83bn.
This is high, which stretches their financial resources. The possibility that one or more of the Swaps might get into difficulties could become an issue if the gold price continues to rise.
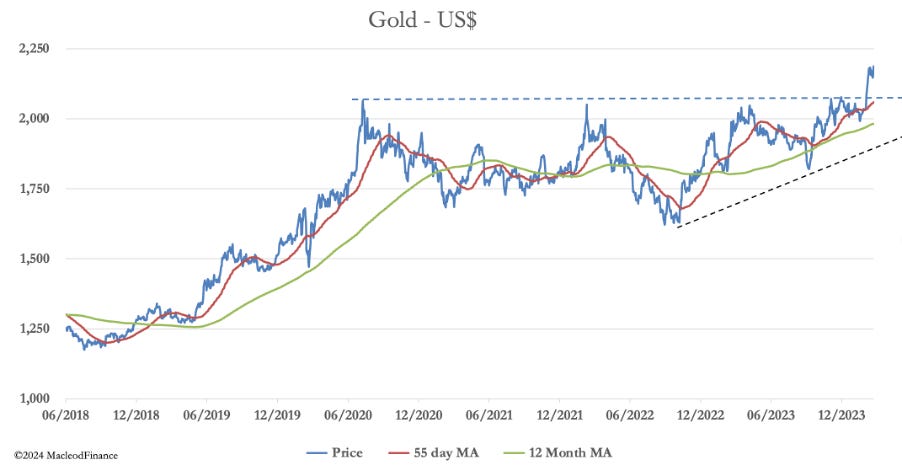
The technical chart is very bullish. This is next:
The message here is that after the current minor pullback, this phase of the bull market is only just starting.
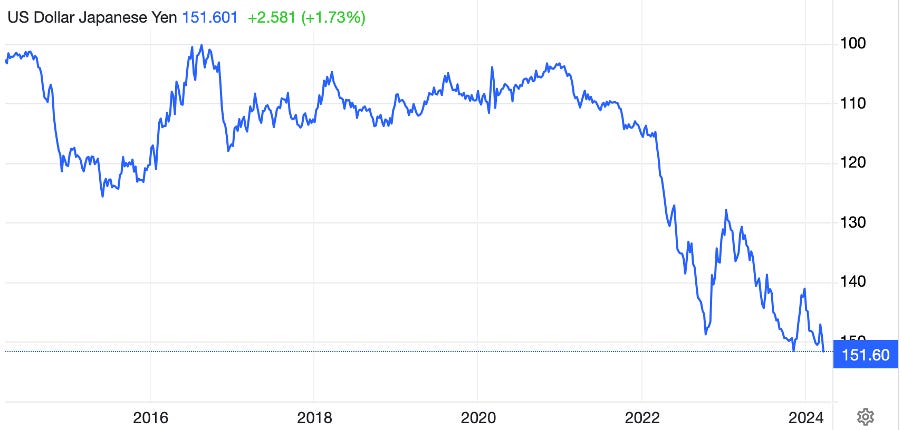
Turning to currencies, in what could turn out to be an important event, the Bank of Japan failed to inspire with its minimal increase in interest rates and is intervening heavily to stop the yen from falling. This is next:
In order to buy back yen, the Bank of Japan is selling dollar reserves and US Treasury paper which becomes a problem for the US Treasury. In the past, Japan and China have been the two largest foreign buyers of Treasuries, but now both are selling. It couldn’t happen at a worse possible time given the scale of funding ahead, with a US budget deficit likely to be over 12% of GDP.




Bert, The SNB is targeting the currency which has been rising sin ce 2022.
I think the sell-off was more apparent than real. DXY spiked and that hurt the US$ gold price, the price in other currencies remained around the peaks.